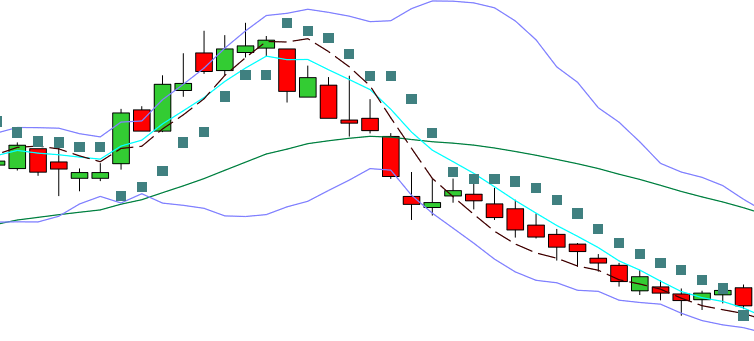
Tulip Indicators (TI) is a library of functions for technical analysis of financial time series data. It is written in ANSI C for speed and portability. Bindings are available for many other programming languages too.

Tulip Indicators is intended for programmers. If you're not a programmer, you may be more interested in Tulip Cell, the Excel add-in, or Tulip Charts, the full featured stock charting program. Both rely on Tulip Indicators for their indicator math.
Tulip Indicators currently implements 104 indicators: abs, acos, ad, add, adosc, adx, adxr, ao, apo, aroon, aroonosc, asin, atan, atr, avgprice, bbands, bop, cci, ceil, cmo, cos, cosh, crossany, crossover, cvi, decay, dema, di, div, dm, dpo, dx, edecay, ema, emv, exp, fisher, floor, fosc, hma, kama, kvo, lag, linreg, linregintercept, linregslope, ln, log10, macd, marketfi, mass, max, md, medprice, mfi, min, mom, msw, mul, natr, nvi, obv, ppo, psar, pvi, qstick, roc, rocr, round, rsi, sin, sinh, sma, sqrt, stddev, stderr, stoch, stochrsi, sub, sum, tan, tanh, tema, todeg, torad, tr, trima, trix, trunc, tsf, typprice, ultosc, var, vhf, vidya, volatility, vosc, vwma, wad, wcprice, wilders, willr, wma, zlema.
Tulip Indicators is released as open source under the LGPL license. This makes it free to use, even in commercial projects, with some restrictions.
